
Golf Course Economics and Management for Facility Survival
This post contains affiliate links. As an Amazon Associate, we earn from qualifying purchases.
This post contains affiliate links. As an Amazon Associate, we earn from qualifying purchases.
Golf course economics and management hinge on three numbers: a $1 million average annual maintenance budget, with nearly 60% of it spent on labor, and a 23% average share of total revenue. The distance between these figures and the actual conditions on the ground decides whether a course thrives, survives, or gets sold.
The $999,585 national average for 2023 looks tidy in a report, but it’s a composite of extremes. A Southwest course averages over $1.5 million while one in the North Central region scrapes by on $661,000. This isn’t just about geography. It’s about the deferred maintenance bill coming due, often in the form of a 40-year-old irrigation pump whose failure can shut down play for six months. Budgets are a snapshot of priorities, and the snapshot from the last decade shows a chronic underfunding of infrastructure in favor of short-term playability.
What follows: a line-by-line breakdown of where the money actually goes, why labor costs are both unavoidable and a point of control, the multi-million-dollar price tag of catching up on delayed projects, and the financial realities that separate a sustainable operation from one living on borrowed time.
Key Takeaways
- The single largest line item in any golf course budget is labor, consuming 59.5% of the average maintenance spend. Controlling this cost requires efficiency, not just cutting staff.
- Deferring capital projects like irrigation replacement saves money in the short term but creates a massive future liability, often exceeding $1.5 million for a full system, that can cripple operations.
- Comparing courses by total budget is misleading. Judge financial health by cost per maintained acre, rounds played, and member satisfaction, not by raw spend.
- Public, private, and resort courses have fundamentally different economic engines (green fees vs. Dues vs. Package rates), which dictate their management strategies and investment thresholds.
- A course’s physical characteristics, especially its maintained turf area, directly and predictably impact its gross margin, making efficient design a long-term economic advantage.
The 2023 Maintenance Budget Breakdown
Open any golf course management textbook and you’ll find theories. Open the GCSAA’s 2024 survey and you find the ground truth. The nationwide average maintenance budget for an 18-hole course in 2023 was $999,585. That figure is the starting point, but the distribution beneath it tells the real story.
The pie chart doesn’t lie. Labor isn’t just the biggest slice; it’s more than half the pie. Equipment, chemicals, and fertilizer fill out the rest. This allocation isn’t a choice, it’s the physics of growing and cutting grass at a tournament level week after week.
Common mistake: Judging a course’s financial health by its total maintenance budget alone. A $1.2 million spend at a high-end private club with 150 acres of manicured turf is efficient. The same spend at a 90-acre municipal with poor drainage is a bleeding wound.
Here is how the average dollar was split in 2023, according to the GCSAA maintenance budget survey:
| Expense Category | Percentage of Budget | What It Buys (And Risks If Cut) |
|---|---|---|
| Labor | 59.5% | Mowing, trimming, bunker maintenance, course setup. Cut this too deep and playing conditions deteriorate within two weeks. |
| Equipment Lease/Repair | 5.9% | Mower leases, tool repairs, fleet upkeep. Defer this and equipment failures cause unplanned closures. |
| Fertilizer | 5.5% | Nutrient programs for greens, tees, fairways. Skimp here and disease pressure rises, requiring more expensive fungicides later. |
| Repair & Maintenance | 4.5% | Shop costs, small parts, preventive maintenance. Ignore this and a $500 repair becomes a $5,000 mower replacement. |
| Fungicides | 4.3% | Disease prevention on high-value turf. Skip an application during a wet period and you can lose a green in 10 days. |
| Fuel & Lubricants | 3.2% | Diesel for tractors, gas for utility vehicles. This cost fluctuates with oil prices and is largely unavoidable. |
The 23% Rule. Across all facility types, maintenance consumes an average of 23% of total gross revenue. This is a crucial benchmark. When maintenance costs creep toward 30% of revenue, the operation is eating into capital reserves or debt service capacity. When it falls below 20%, it’s often a sign of deferred investment, the course might look acceptable today, but its irrigation system or drainage infrastructure is a time bomb.
Where this goes sideways: A superintendent is pressured to trim the budget. The easiest target is often the equipment replacement fund or the capital project reserve. That saves $50,000 this year. But when the primary irrigation pump seizes three years later, the replacement cost has ballooned, and the course faces a 2-6 month closure waiting for parts and installation. The Knoxville study found exactly this scenario: a 40-year-old pump at Whittle Springs with no viable backup.
Why Labor Costs Are Sticky (And How to Manage Them)
You cannot mow 100 acres of grass with a smartphone app. Labor is the bedrock cost, and it’s rising. The Hillier Hopkins survey of UK clubs noted a 9% year‑on‑year increase in course wage costs, a trend mirrored in the U.S. Due to competition for skilled technicians and inflationary pressures. The challenge isn’t just the hourly rate; it’s the sheer number of man‑hours required for basic conditioning.
A modern triple‑head greens mower is a $30,000 piece of precision engineering. It still requires a trained operator to run it for four hours every morning. That’s the paradox of golf course economics: technology augments labor; it rarely replaces it on the scale needed.
The part nobody mentions: Labor inefficiency often hides in poor process, not poor people. A crew spending 30 minutes each morning moving hoses and setting sprinklers by hand is a process failure. A half‑mile round‑trip to the maintenance barn for a forgotten tool burns 15 minutes of fuel and wages. These micro‑inefficiencies add up to thousands of dollars in wasted labor per season.
Three leverage points for labor management:
- Invest in labor‑saving technology where it counts. A central irrigation control system that allows one person to water the entire course from a laptop saves dozens of man‑hours weekly. The return on investment is calculated in reduced overtime, not just water savings.
- Cross‑train your staff. A mechanic who can also mow roughs when equipment is down is more valuable. A spray technician who understands basic diagnostics keeps a critical machine running. This flexibility reduces downtime and overtime costs.
- Measure output, not just hours. The goal is “greens mowed to 0.110” by 8 AM,” not “crew arrives at 6 AM.” Focusing on outcomes, especially for repetitive tasks, naturally drives efficiency as crews figure out faster methods to hit the standard.
Sensory reality check: Walk the maintenance barn at 5:30 AM. The smell of fresh‑cut grass is there, sure. But listen for the sounds of efficiency: the quiet hum of electric utility vehicles instead of gas‑engine clatter, the organized clatter of pre‑loaded toolboxes, not the frantic search for a sprocket. That’s the sound of a labor budget under control.
Capital vs. Operational Budgets: The $300,000 Gap
This is the split that determines long‑term viability. The operational budget pays for the daily mow, the weekly fertilizer, the monthly payroll. The capital budget pays for the new fairway mower, the rebuilt bunkers, the irrigation system replacement. They are different pots of money, and the capital pot is the one that gets raided first when times are tight.
The data is stark. The GCSAA reports that the average capital budget for golf courses increased by 53% from 2022 to 2025, jumping from $198,631 to $303,088. That’s not growth driven by ambition; it’s inflation and catch‑up. The same survey shows that new irrigation is the single most expensive project, averaging $1.53 million, and is a high or very high priority for nearly half of all superintendents.
| Project Type | Average Cost (2025) | Typical Funding Source | Consequence of Deferral |
|---|---|---|---|
| New Irrigation System | $1,530,687 | Long‑term loan, capital campaign | Inconsistent turf, high water waste, risk of total failure & extended closure. |
| Rebuild Sand Bunkers | $280,323 | Operational savings, assessment | Poor drainage, worsening playability, increased maintenance labor. |
| New/Rebuild Practice Areas | $232,986 | Operational budget, member assessment | Lost revenue from lessons & clinics, member dissatisfaction. |
| Major Drainage | $87,372 | Operational budget, capital reserve | Wet spots, cart path restrictions, lost playable days. |
| Add/Rebuild Tees | $45,602 – $90,731 | Operational budget | Overcrowded tee boxes, wear patterns, slower pace of play. |
The deferred maintenance trap: A course defers a $300,000 bunker renovation for five years. During that time, labor costs to maintain those failing bunkers increase by 20%. The cost of sand, liners, and drainage pipe inflates by another 15%. The project that was $300,000 is now $400,000, and the playing conditions have driven away 10 regular foursomes. The math is brutal and one‑way.
A case study in capital starvation: The City of Knoxville’s 2023 golf study is a public document of what happens when capital investment is severed from operations. Over a decade, the recommended annual investment for its two courses was $193,700. The actual average spent was less than a third of that, with 70% of that meager sum going to cart paths, a visible amenity, while the irrigation systems at both facilities decayed to “barely functional.” The report concludes that over $3.8 million should have been invested in that period; only $1.18 million was. The bill for that difference is now due, with interest.
The capital budget is the course’s future. An owner or board that views it as discretionary is betting that the facility can be sold before the music stops. For every course that wins that bet, three others end up like Knoxville Municipal: functionally obsolete and facing a multi‑million dollar rebuild just to stay in the game.
Public, Private, and Resort: Three Different Economic Engines
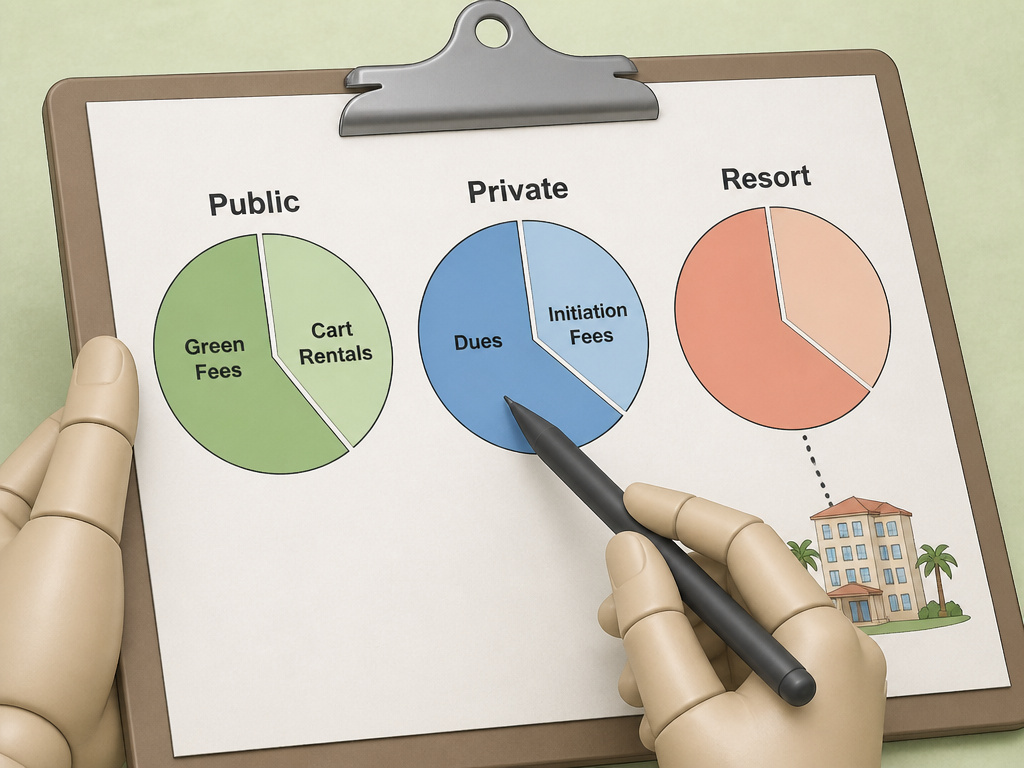
A daily‑fee course, a members’ club, and a resort aren’t just different styles of golf. They are fundamentally different businesses with unique course business models, revenue streams, and cost structures. Managing one with the logic of another is a recipe for financial trouble.
The Public/Daily‑Fee Model
- Revenue Engine: Green fees and cart rentals. Revenue is intensely sensitive to weather, seasonality, and direct competition. Price is a key lever.
- Management Focus: Maximizing rounds per available day (RPAD). This means dynamic pricing, efficient tee‑sheet management, and strong marketing to fill off‑peak times. The maintenance budget is often the most scrutinized, as it’s a pure cost center against per‑round revenue.
- The Pressure Point: Cost per round. With revenue tied directly to play, every dollar of maintenance must be justified by its impact on the golfer’s willingness to pay. Spending $15,000 per maintained acre (like many Southwest courses) is only sustainable with green fees over $100.
The Private Club Model
- Revenue Engine: Membership dues and initiation fees. Revenue is recurring and predictable, creating a stable base for budgeting. The focus shifts from maximizing rounds to maximizing member satisfaction and retention.
- Management Focus: Per‑member value. Capital projects are often funded through assessments or capital campaigns tied to a long‑term master plan. The maintenance budget is about achieving a consistent, high‑quality standard that justifies the dues, not optimizing for round volume. Labor costs can be higher due to more detailed attention.
- The Pressure Point: Surplus generation. The Hillier Hopkins survey shows the average surplus for members’ clubs was £175,000. This surplus is critical for funding capital projects without debt. Clubs that operate at break‑even have no mechanism for reinvestment and slowly degrade.
The Resort Course Model
- Revenue Engine: Often bundled into hotel or vacation packages. The golf course is a loss‑leader or amenity that supports the primary business (rooms, real estate, hospitality). Green fee revenue may be secondary to overall destination appeal.
- Management Focus: Peak‑experience conditioning. The course must be impeccable for the guest’s one round, requiring a different agronomic strategy than a course seeing the same players daily. Budgets can be higher, justified by the room rate they support.
- The Pressure Point: Integration with the broader resort resort course model. The economics only work if golf drives premium room bookings or real estate sales. A standalone resort course in a remote location faces the same per‑round pressures as a public course, with much higher overhead.
Easy to miss: The type of course dictates the relevant financial metric. For a public course, watch cost per round. For a private club, watch surplus per member. For a resort, watch the premium on room rates attributable to the golf experience. Confusing these leads to poor decisions.
Course Design as a Financial Blueprint
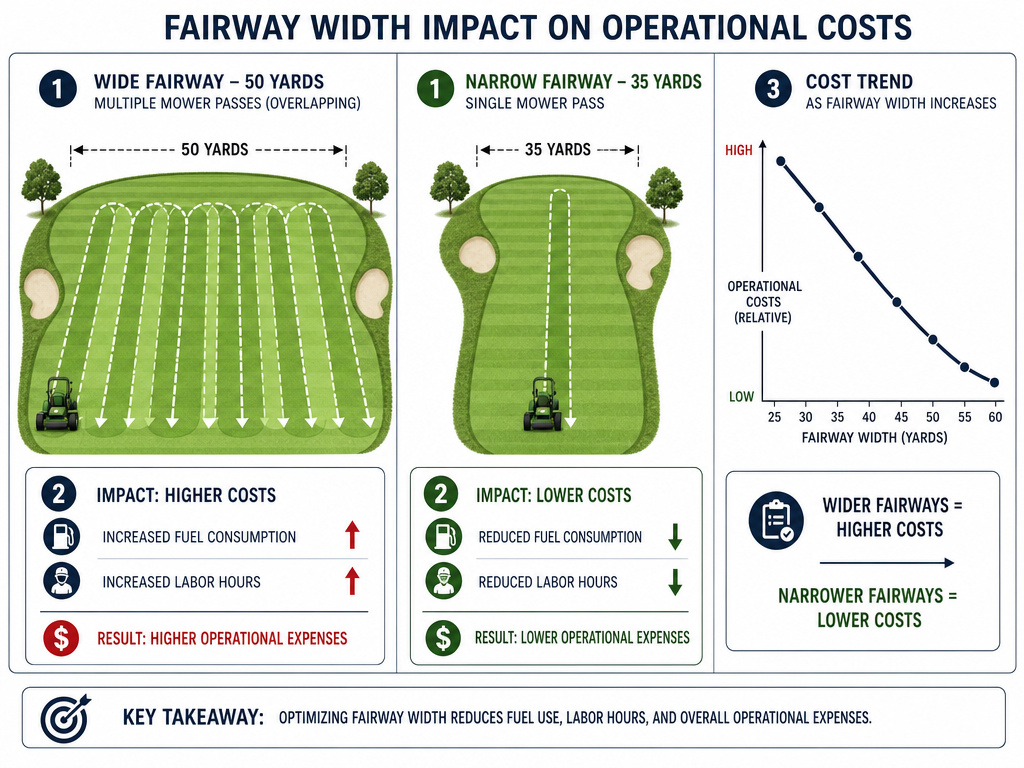
The initial architecture principles are a financial commitment carved into the landscape. A championship course with 150 acres of maintained turf, intricate bunkering, and vast water features isn’t just an athletic test; it’s a machine with a specific, high fuel consumption. The 2004 study “Factors Affecting the Profitability of Golf Courses in Georgia” found a direct, negative correlation: larger turfgrass area per hole significantly lowered gross margins for private courses. The more grass you grow, the more you must cut, water, and fertilize, forever.
Efficient design is sustainable economics. A great golf course uses its land strategically. It employs natural drainage, native areas that require no maintenance, and a routing that minimizes travel distances for maintenance crews. These aren’t just aesthetic or environmental choices; they are cold, hard financial calculations that reduce the operational budget for the life of the course.
Consider the humble fairway width. A 35‑yard wide fairway requires one pass with a large mower. A 50‑yard wide fairway requires overlapping passes, increasing mowing time by 40% and fuel consumption proportionally. That single design decision adds thousands of dollars in annual labor and fuel costs, compounded over decades.
The irrigation imperative. Modern turf management is impossible without precise water control. A course designed with a logical, zonal irrigation plan is cheaper to water and easier to maintain. A course with odd‑shaped greens and scattered tee boxes, legacy of an older golf course design, requires more heads, more pipe, and more labor to manage. The capital cost of installing the system is higher, and the operational cost of running it never ends.
What does the ball flight tell us? In this case, it tells us that the most expensive shots are often the ones that never happen, the rounds lost because the course is closed for a week to replace a failed pump that was undersized from day one. Good course architecture plans for the maintenance budget, not just the opening day ribbon‑cutting.
The Superintendent’s Role: Economist in Chief
The golf course superintendent is often seen as the head agronomist. That’s true. But in the current environment, they are also the facility’s chief economist. They must translate turfgrass needs into line‑item budgets, advocate for capital projects with clear ROI, and manage the largest cost center (labor) with analytical precision. The GCSAA labor cost analysis is their bible, their benchmark, and their best weapon in budget meetings.
Their success isn’t measured by the green speed on Saturday. It’s measured by the cost per maintained acre, the rounds played per labor hour, and the year‑end surplus that gets plowed back into the irrigation replacement fund. They are the bridge between the sustainable maintenance practices that save money and the playing conditions that drive revenue.
The new skill set: Beyond agronomy, a superintendent now needs fluency in data analysis (interpreting soil moisture sensors, weather tracking), mechanical aptitude (to manage an equipment fleet), and financial literacy (to present a capital budget). The superintendent who can’t build a five‑year capital forecast is operating blind, and the facility will pay for that blindness.
Frequently Asked Questions
What is the average profit margin for a golf course?
There is no universal average. Profitability is wildly variable. A well‑run private club might target a 10‑15% annual surplus (profit) to fund capital projects. A public course might operate on a 5‑8% net margin after all expenses, heavily dependent on volume. Many municipally‑owned courses are not designed to turn a profit but to break even as a community service. The key is consistent positive cash flow to fund reinvestment.
How much does it cost to build a new 18-hole golf course?
Land acquisition aside, construction costs typically range from $5 million to $25 million, with $10‑$15 million being a common figure for a quality, non‑championship facility. The largest single expenses are earthmoving/grading, the irrigation system installation, and the clubhouse. The “grow‑in” period of 2‑4 years before the course is fully playable represents additional carrying costs with limited revenue.
Why are golf course maintenance costs so high?
The product is living turfgrass maintained at a precision level across 100+ acres, 12 months a year. It requires skilled labor, expensive specialized equipment (a fairway mower can cost $80,000), and constant inputs like water, fertilizer, and pesticides. There are few economies of scale, mowing twice as much acreage requires nearly twice the labor and fuel. It’s a biologically driven manufacturing process with no downtime.
Can technology reduce golf course maintenance costs?
Yes, but in specific, targeted ways. Centralized irrigation control saves labor and water. GPS‑guided sprayers reduce chemical overlap and waste. Electric utility vehicles cut fuel costs. However, technology is a capital expense. The ROI must be calculated in long‑term operational savings, not immediate budget relief. It augments an efficient team; it doesn’t replace the need for one.
How do public golf courses make money?
Their primary revenue is green fees and cart rentals. Secondary revenue comes from the driving range, golf lessons, merchandise sales in the pro shop, and food & beverage. The most profitable public courses maximize tee‑sheet utilization through dynamic pricing, offer attractive membership or player‑card programs for frequent golfers, and efficiently manage their operating costs, particularly labor.
The Bottom Line
Golf course economics and management aren’t about finding a magic number. They’re about aligning three timelines: the annual operational budget (this year’ fertilizer), the 5‑year capital plan (next year’s fairway mowers), and the 20‑year infrastructure horizon (the irrigation system replacement). The courses that fail are the ones that manage only the first timeline and hope the other two don’t collide.
The data gives you the triggers. When maintenance costs exceed 25% of revenue, scrutinize labor efficiency. When the average age of your major equipment fleet passes 7 years, start planning the replacement fund in earnest. When your irrigation system is older than 20 years, its failure is not an “if” but a “when”, and the capital project to replace it should already be on the board agenda, not a crisis item.
Good management isn’t spending the most money. It’s spending the right money at the right time on the things that actually affect golfer satisfaction and long‑term asset value. Strip it back. That’s the whole game.
