
What Is Strokes Gained in Golf? The Key Modern Golf Metric
This post contains affiliate links. As an Amazon Associate, we earn from qualifying purchases.
This post contains affiliate links. As an Amazon Associate, we earn from qualifying purchases.
Strokes gained in golf is an advanced performance metric that measures every shot you take against a benchmark, usually PGA TOUR professional averages. The core formula is Strokes Gained = J(start) - J(finish) - 1, where J is the average strokes to finish from a given distance and condition. A positive number means you beat the benchmark; a negative number means you lost strokes. It breaks down your game into specific categories like driving, approach, and putting to show exactly where you gain or lose shots.
The formula’s power comes from its grounding in millions of real shots. It doesn’t just count fairways or putts; it weighs each shot’s outcome against what a pro would do from that exact spot, whether it’s 200 yards in the fairway or 60 yards in the rough.
What follows: the origin story from a Columbia professor, a walkthrough of the math that makes it work, the four key categories it analyzes, and why this metric finally tells you the truth about your game that fairways hit and total putts never could.
Key Takeaways
- The metric was created by Professor Mark Broadie using PGA TOUR ShotLink™ data starting from 2003, turning millions of shots into a benchmark.
- Long game shots (over 100 yards out) account for roughly two-thirds of scoring differences between tour pros, making approach play and driving critically important.
- Unlike counting stats, strokes gained evaluates the quality of each shot by its start and end location, so a 320-yard drive into the rough can still be a gain if it leaves a much shorter approach.
- For amateurs, the benchmark should be other players of your handicap level, not tour pros, to give actionable feedback.
- The goal is to identify your single biggest leak. Improving that one area by half a stroke per round cuts 9 shots off your annual score.
The Origin Story: From Academic Paper to Tour Standard
You didn’t hear about strokes gained on a broadcast ten years ago. It arrived in 2011 with a Columbia University professor named Mark Broadie. He published a paper titled “Assessing Golfer Performance on the PGA TOUR,” and it rewrote how the game measures itself.
The fuel for this was data. The PGA TOUR’s ShotLink™ system had been recording the location of every single shot in tournament play since 2003. By 2007, that dataset, over eight million shots, was available to academics. Broadie didn’t just count fairways; he asked a better question: from any given spot on the course, how many strokes does it take the average tour pro to finish the hole?
This research, detailed in Broadie’s original strokes gained methodology document, created the
J(d,c)function: the average strokes to finish from distancedand conditionc(fairway, rough, sand, etc.). That function is the bedrock of the entire system.
Before this, we had stats that lied. A fairway hit could be a 150-yard dribbler. A two-putt could be from 50 feet or from 5 feet. Broadie’s model cut through the noise. It gave every shot a value based on where it started and where it finished, relative to a professional benchmark. The tour was slow to adopt it publicly, but coaches and players were using it privately within years. Now, it’s the language of tournament analysis.
The Core Strokes Gained Formula: It’s Just Subtraction
The jargon makes it sound complex. It’s not. Strokes gained is a simple subtraction problem for every shot you hit.
The official formula is: Strokes Gained = J(d1, c1) - J(d2, c2) - 1.
Let’s translate that.
* J(d1, c1): The average number of strokes a benchmark player (e.g., a PGA TOUR pro) takes to finish the hole from your shot’s STARTING location and condition (distance d1, lie c1).
* J(d2, c2): The average strokes to finish from your shot’s ENDING location and condition (distance d2, lie c2).
* - 1: You just took one stroke. Subtract it.
If the benchmark average from 150 yards in the fairway is 2.8 strokes. You hit the green, and the benchmark average from 20 feet on the green is 1.5 strokes. Your strokes gained on that shot is: 2.8 – 1.5 – 1 = +0.3. You gained three-tenths of a stroke on the field.
A negative number means you lost strokes. If you chunk that same 150-yard shot into a front bunker, and the benchmark from there is 2.3 strokes, your calculation is: 2.8 – 2.3 – 1 = -0.5. You lost half a stroke.
| Shot Scenario | Start Avg (J1) | Finish Avg (J2) | Calculation | Strokes Gained |
|---|---|---|---|---|
| 150y Fairway to 20ft Green | 2.8 | 1.5 | 2.8 – 1.5 – 1 | +0.3 |
| 150y Fairway to Front Bunker | 2.8 | 2.3 | 2.8 – 2.3 – 1 | -0.5 |
| 8ft Putt (Make) | 1.5 | 0.0 | 1.5 – 0.0 – 1 | +0.5 |
| 8ft Putt (Miss) | 1.5 | 1.0 | 1.5 – 1.0 – 1 | -0.5 |
Where this goes sideways: Thinking a made 8-foot putt is a “gain” and a missed one is “neutral.” The benchmark make rate is 50%, so the expected strokes from 8 feet is 1.5. Making it gains you half a stroke; missing it loses you half a stroke. Every putt has a value.
This is the calculation method that apps like Arccos and Shot Scope run automatically for every shot you track. You don’t do the math; they give you the result. Your job is to understand what the numbers are telling you.
The Four Categories: Where Are You Winning and Losing?
You don’t get one big number. You get a breakdown. Modern strokes gained analysis splits your game into four primary categories, each answering a specific question.
Strokes Gained: Off the Tee
This measures all tee shots on par-4s and par-5s. It combines distance and accuracy. A 300-yard drive into the first cut of rough will often show as a gain compared to a 230-yard drive in the fairway. Why? Because the next shot is from 60 yards instead of 130. The metric quantifies that trade-off. If your off-the-tee metric is consistently negative, the issue is either a lack of distance, wild inaccuracy (OB, water), or both.
Strokes Gained: Approach
This covers all shots from over 100 yards out that are not tee shots on par-4/5s. For most amateurs, it is the most important category. Hitting greens is good, but leaving the ball in the right spot is what creates gains.A 30-foot putt is a better outcome than a greenside bunker, and the metric reflects that. Poor iron shot performance is the biggest score-wrecker for club golfers.
Strokes Gained: Around the Green
This includes all shots within 100 yards of the hole that are not putts. Chipping, pitching, bunker play. It measures your ability to save par and avoid double bogeys. A good short game performance shows up as a small positive number or a less-negative one. It’s about damage control and converting up-and-down opportunities.
Strokes Gained: Putting
This is all shots on the putting surface. It’s the most intuitive category because the benchmarks are straightforward. The key insight is that a 40-foot lag putt to 3 feet is often a gain, while a missed 4-footer is a massive loss. Your putting metric tells you if you’re holing out well or if you’re three-putting too often from long range.
Add these four categories together, and you get Strokes Gained: Total, your overall performance against the benchmark for that round.
Common mistake: Focusing only on the total. A +2.0 total is great, but if it’s built on +3.0 putting and -1.0 approach, your score is on borrowed time. Putting is volatile. Ball-striking (Off the Tee + Approach) is stable. Fix the stable negatives first.
The Tiger Woods Proof: Why Long Game Dominates

The data from Broadie’s study settled an old debate. Is it putting or ball-striking? For PGA TOUR players, the long game is king.
The analysis of over eight million shots found that long game shots (those starting over 100 yards from the hole) explain approximately two-thirds of the scoring differences between players. Your driver and your irons matter more than your putter for separating yourself from the field.
Tiger Woods in his prime was the ultimate case study. During the 2003-2010 period studied, he led the tour in total strokes gained at +3.20 strokes per round. Of that massive advantage, +2.08 strokes, about 65%, came from his long game. He was elite in every category, but his driving and iron play built his dominance.
This doesn’t mean putting is unimportant. It means consistency in scoring comes from consistent ball-striking. You can’t putt your way to a great score if you’re never hitting greens in regulation. For amateurs, this translates to a clear priority: improving your approach shots and driving accuracy will lower your scores faster and more reliably than chasing a magical putter.
Strokes Gained vs. Traditional Stats: Why Fairways Hit Lies
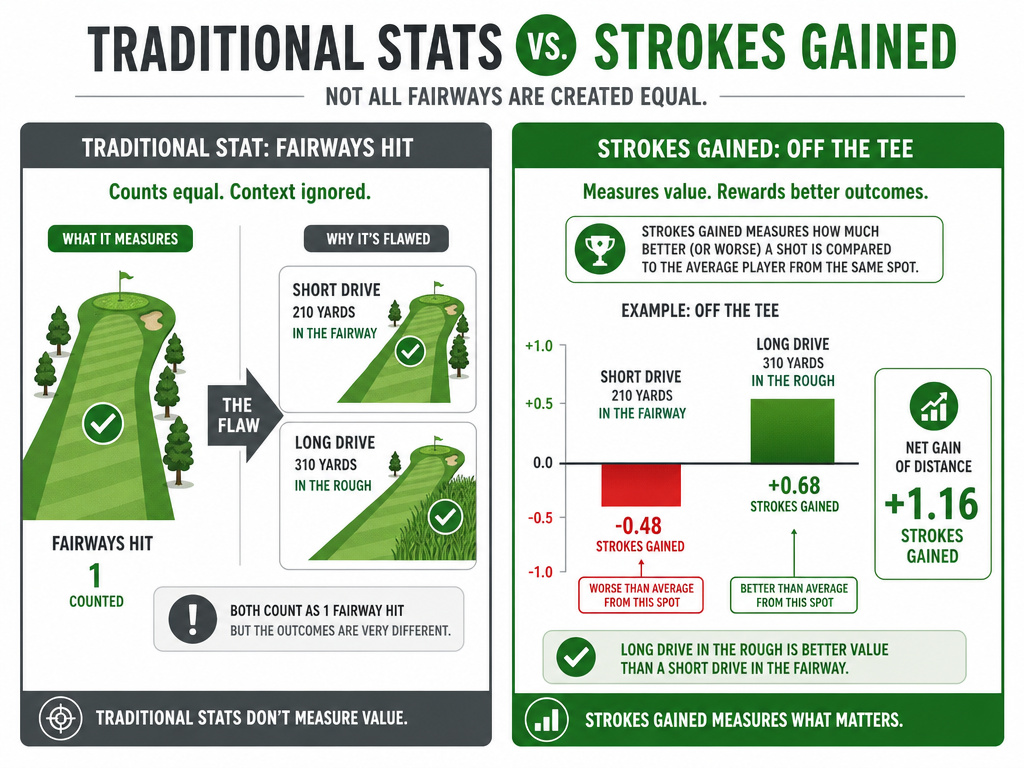
This is where the rubber meets the road. Let’s compare the old way to the new way.
| Traditional Stat | What It Measures | The Flaw | Strokes Gained Insight |
|---|---|---|---|
| Fairways Hit | Did the tee shot finish in the short grass? | A 180-yard dribbler and a 300-yard bomb in the light rough both count the same. Ignores distance entirely. | Weighs both distance and accuracy. A long drive in the rough is often a net gain due to a shorter, easier next shot. |
| Greens in Regulation (GIR) | Did you reach the green in par minus two strokes? | A green hit 60 feet away and one hit 10 feet away count the same. No quality measure. | Values proximity. Hitting it closer to the hole is a measurable gain, even if both shots count as a GIR. |
| Putts per Round | Total number of putts taken. | Heavily influenced by your ball-striking. Great chippers can have low putt totals because they’re putting from closer. | Isolates putting performance based on the distance of each first putt. A two-putt from 40 feet is a gain; a two-putt from 10 feet is a loss. |
The traditional stats are not useless. They give a broad overview. But they are blunt instruments. Strokes gained is a scalpel. It answers the “why” behind the number. You don’t just know you missed fairways; you know if those misses were costly or not. This is the fundamental advantage when comparing strokes gained versus traditional metrics.
I used to pride myself on high fairways-hit percentages. Then I saw my strokes gained off the tee was negative. The data showed my “safe” drives were leaving me 180-yard approaches instead of 120-yard ones. I was trading a minor accuracy gain for a massive approach-shot penalty. I started hitting driver more.
How Amateurs Should Use Strokes Gained: Benchmarks That Matter
Comparing yourself directly to PGA TOUR benchmarks can be depressing and misleading. Losing 2 strokes per round on approach shots to Rory McIlroy doesn’t tell you what to fix.
The modern solution is handicap-level benchmarking. Advanced shot-tracking systems like Arccos and Shot Scope are building databases of tens of millions of amateur shots. They can now answer: what is the average number of strokes for a 15-handicap to finish from 150 yards in the fairway?
This changes everything. Now your strokes gained data tells you how you stack up against your peers. If you’re a 15-handicap but gaining strokes off the tee against other 15-handicaps, that’s a strength. If you’re losing a stroke per round on approach shots against your benchmark, that’s your leak. This is the actionable insight.
| Handicap Benchmark | Avg Strokes from 150y Fairway | Avg Strokes from 60y Rough | Key Takeaway |
|---|---|---|---|
| PGA TOUR | 2.80 | 2.95 | Tour pros are only slightly worse from the rough at this distance. |
| 10 Handicap | 3.10 | 3.40 | The rough penalty is larger. Accuracy has more value. |
| 20 Handicap | 3.40 | 3.90 | The rough penalty is severe. Keeping the ball in play is critical. |
Your goal is to move your personal benchmarks down over time. Did your average strokes from 100 yards in the fairway drop from 2.9 to 2.7 over a season? That’s measurable improvement that a handicap index might not fully reflect.
Frequently Asked Questions
What’s a good strokes gained number?
There’s no universal “good” number. For a tour pro, “good” is positive. For an amateur, compare against your handicap benchmark. If you’re a 10-handicap and your strokes gained total is +0.5 against other 10-handicaps, you played better than your average. The number itself matters less than the trend and the category breakdown.
Do I need a fancy GPS tracker to use strokes gained?
Yes, effectively. You need a system that records the start and end location of every shot with precision. Dedicated sensors like Arccos Caddie or Shot Scope, or advanced GPS watches, automate this. Manually entering data into an app after the round is possible but tedious and prone to error.
How does strokes gained handle penalty strokes?
It handles them directly. A shot that goes out of bounds starts from one location and finishes with a penalty stroke added, effectively making the “finish” location the same as the start (stroke-and-distance) or a drop zone. The formula captures the massive stroke loss because the J(finish) value doesn’t improve much, but you still subtract the stroke taken. It’s one of the clearest examples of the metric quantifying disaster.
Can strokes gained help me practice smarter?
Absolutely. It turns practice from guesswork into a targeted mission. If your data shows you lose 0.8 strokes per round on approach shots from 150-175 yards, you now know to spend 60% of your range time on that specific yardage with your 7 or 8-iron. You’re not just hitting balls; you’re plugging a documented leak.
What’s the difference between net and gross strokes gained?
Gross score strokes gained measures your performance against a scratch or professional benchmark. Net score strokes gained would apply your handicap strokes to the calculation, effectively measuring performance against a “net par.” Most consumer systems use gross benchmarks, but the concept of comparing to your peer group (like a 10-handicap benchmark) serves a similar purpose to a net analysis.
Before You Go
Strokes gained is a lens that finally shows your game in high definition, moving beyond being just another statistic. It moves you past “I putted badly” to “I lost 1.2 strokes on putts between 4 and 8 feet.” That specificity is power.
Start by understanding the four categories. Get your hands on your data, whether through a tracking system or a detailed manual log for a few rounds. Find your single biggest negative category. Not your worst shot, but the area where you consistently lose the most strokes over 18 holes. That’s your project for the next three months.
The goal is to use one clear number, strokes gained, to make one clear change, rather than to become a data scientist. That’s how you stop guessing and start improving.
