
Golf Swing Analysis: How It Works and Improves Your Game
This post contains affiliate links. As an Amazon Associate, we earn from qualifying purchases.
This post contains affiliate links. As an Amazon Associate, we earn from qualifying purchases.
Golf swing analysis works by using technology, like 3D motion capture, high-speed cameras, or wearable sensors, to measure the precise movements of your body and club. The goal is to map the kinematic sequence: the timing of how energy transfers from your pelvis to your torso, arms, and finally the clubhead. This data reveals if your swing is efficient or if compensations are costing you speed and accuracy.
The tools range from million-dollar lab systems filming at 500 frames per second to consumer-grade swing analyzers you strap to your glove. The output isn’t just a pretty video; it’s a set of numbers, peak rotational velocities, separation angles, and millisecond timings, that describe your swing’s unique fingerprint.
What follows is a breakdown of the two core concepts every analysis measures (the kinematic sequence and the X-factor), the technology that captures them, and how that data translates into a lesson you can actually use. By the end, you’ll know what to look for in any swing report and how to separate useful feedback from noise.
Key Takeaways
The kinematic sequence is the essential engine of power: pelvis, torso, arms, club. If your arms peak before your torso, you’re leaking speed and inviting inconsistency. * X-factor stretch, the extra separation between hips and shoulders at the start of the downswing, is a hallmark of efficient swings, but forcing it by restricting hip turn is a direct path to back pain. * Modern analysis uses inertial measurement unit (IMU) sensors that provide lab-grade kinematic data on the range for a fraction of the cost of a full 3D camera system. * A 2023 study created a Swing Performance Index from 3D data that differentiated pros from amateurs with 97% accuracy, using just three metrics: pelvic velocity pre-impact, pelvic velocity at impact, and torso velocity post-impact. * Good analysis doesn’t just show you what’s wrong; it identifies the physical cause upstream. A slice isn’t just an open face, it’s often an early torso peak or a lateral head shift measured in centimeters.
The Kinematic Sequence: Your Body’s Engine
Forget style. The one thing every efficient golf swing shares is a specific order of operations. This is the kinematic sequence: the proximal-to-distal timing of how your body segments reach peak rotational speed.
In a coordinated swing, the pelvis rotates first and reaches its maximum angular velocity, followed by the torso, then the lead arm, and finally the clubhead. Each segment peaks after the previous one, creating a whip-like transfer of energy that maximizes speed at impact.
Think of cracking a whip. The handle moves first (pelvis), the wave travels through the middle section (torso, then arms), and the tip (clubhead) snaps with explosive speed. If you move the middle section too early, the wave never reaches the tip with full force.
Amateurs commonly reverse this sequence. They start the downswing with their arms or shoulders, a move often called “casting” or “over-the-top.” The data shows it clearly: the arm segment’s velocity line spikes before the torso’s. This isn’t just a power leak. It forces a cascade of compensations, early extension, flipping the hands, to square the clubface, destroying consistency.
Where this goes sideways: An early torso peak relative to the pelvis often indicates poor core engagement. The player is pulling down with their shoulders instead of driving from the ground up. The ball might still go far, but the miss is a violent two-way pull-slice, and the player’s lower back is sore after 14 holes.
The proof is in the research. A study published in Sports analyzed 3D kinematics and found that the choice of computational method can change the identified sequence entirely. This highlights a key point: the sequence is a real phenomenon, but measuring it perfectly is complex. Still, the general pattern, pelvis, torso, arms, club, is the gold standard.
Measuring the Motion: The Tools of the Trade
To capture the kinematic sequence, you need tools that can track the rotation of individual body segments in three dimensions and at high speeds. The technology falls into two broad camps: optical systems and inertial sensors.
Optical Motion Capture (The Lab Standard)
This is the high-fidelity, high-cost option used in biomechanics labs and elite facilities like the Titleist Performance Institute. Multiple high-speed cameras (often filming at over 500 frames per second) surround the golfer. Reflective markers are placed on key anatomical points, hips, shoulders, elbows, wrists, the club.
The system triangulates the marker positions in space, building a dynamic 3D skeleton model. Software like Vicon or the open-source OpenSim then calculates the exact angles and velocities of each segment. This is how the foundational research on the kinematic sequence and X-factor was conducted. The detail is incredible, but you’re not bringing this to the driving range.
Inertial Measurement Units (IMUs) – The On-Range Revolution
This is the accessible, practical evolution. IMU sensors are small, wearable devices containing gyroscopes and accelerometers. You strap them to your pelvis, upper spine, lead arm, and hand. As you swing, they measure rotational velocity and orientation in real-time.
Companies like Noraxon have built dedicated golf software (like their MR 4.2026.1 platform) that uses four IMU sensors to automatically detect swing events and generate a kinematic sequence report. The system provides the same core data, peak timings and velocities for each segment, that you’d get from a camera system, but you can use it anywhere. This is the technology now bridging the gap between tour-level analysis and committed amateurs.
| Technology | How It Works | Best For | Key Limitation |
|---|---|---|---|
| High-Speed 3D Cameras | Tracks reflective markers with multiple cameras at 500+ fps. | Biomechanics research, elite player fitting, establishing gold-standard data. | Extremely costly, requires controlled lab environment, complex setup. |
| Wearable IMU Sensors | Gyroscopes/accelerometers in body-worn pods measure segment rotation. | On-range coaching, affordable kinematic feedback, multi-swing practice sessions. | Can be sensitive to improper sensor placement; requires calibration. |
| Consumer Swing Analyzers | Single sensor (often on glove or club) estimates metrics via algorithms. | General feedback on tempo, swing plane, and clubhead speed for beginners. | Infers body movement; cannot measure true pelvis-torso separation (X-factor). |
| Launch Monitor Radar | Doppler radar tracks clubhead and ball flight parameters (speed, spin, launch). | Fitting for distance, optimizing ball flight, quantifying shot outcomes. | Measures result, not cause; tells you what happened, not why it happened. |
For most players working on their move, a capable golf swing analyzer or a professional using an IMU system provides more than enough actionable data. The question is what you do with the numbers.
The X-Factor and Separation: Storing Elastic Energy
If the kinematic sequence is the timing of the whip, the X-factor is how much you load it. This term describes the rotational separation between your shoulders (torso) and your hips (pelvis) during the swing. The concept is simple: more coil on the backswing can mean more potential power.
But the devil is in the dynamic details. The static “X-factor” is the difference at the top of your backswing. The X-factor stretch is the critical moment in early downswing where your hips begin rotating toward the target before your shoulders have fully unwound, briefly increasing the separation.
Common mistake: Trying to maximize the static X-factor by restricting hip turn. This strains the lower back by forcing the torso to rotate against a braced lower body. The power gain is mythical; the injury risk is real.
A proper turn involves stretching and turning. The obliques and other core muscles are designed to be stretched across the body, like pulling a rubber band from your left foot to your right shoulder, before they contract. This stretch-contract cycle is how your body generates power safely. Modern instruction, informed by 3D analysis, focuses on achieving separation through a full, athletic turn where the pelvis rotates substantially but the torso rotates even more.
The data from a golf swing work and power analysis shows that efficient swings maintain torso tilt and spine angle while achieving this separation. When the X-factor plot on a report shows a smooth increase in backswing, a sharp peak early in the downswing (the stretch), and then a rapid decrease into impact, you’re looking at an efficient move. A flat or erratic plot signals a power leak.
From Data to Diagnosis: How Analysis Informs Instruction
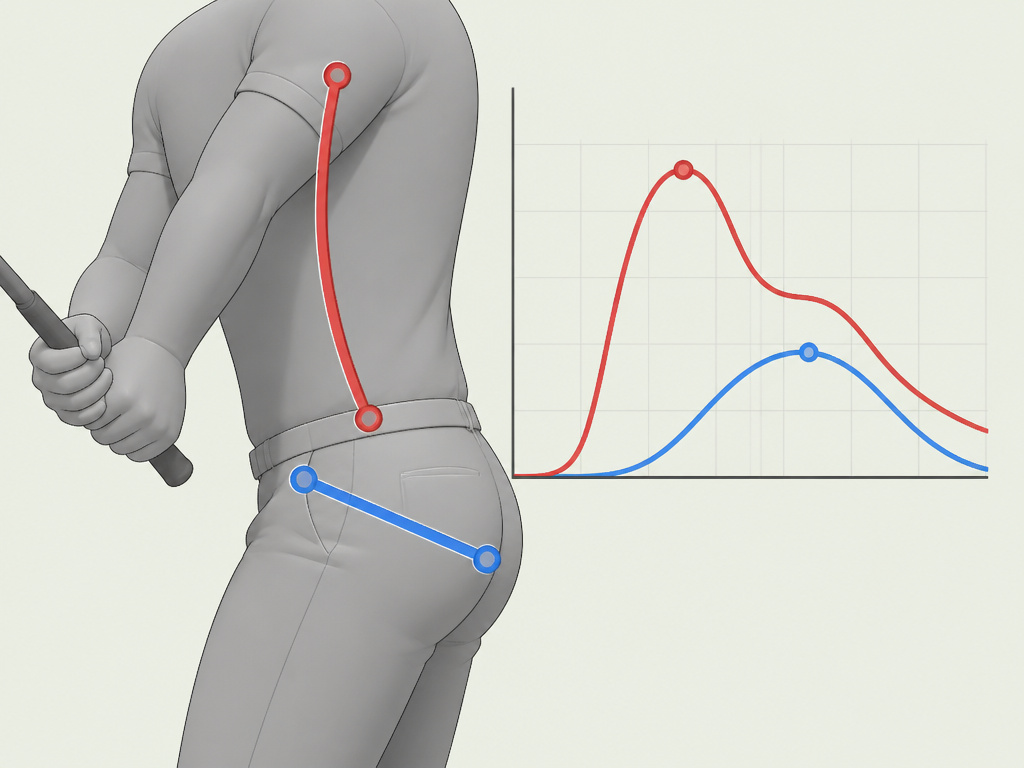 Raw data is just noise. The coach’s job is to interpret it through the lens of cause and effect. Good golf swing analysis connects a flawed data signature to a physical movement the player can feel and change.
Let’s take a common data pattern: Early Peak Torso Velocity. * What the report shows: The red “torso” line on the kinematic sequence graph spikes before the blue “pelvis” line has peaked. * The physical cause: The player is initiating the downswing by pulling the handle down with their shoulders and upper back. The lower body is passive or sliding laterally instead of rotating. * The on-course symptom: Loss of distance, a tendency to hit high weak slices or pull-hooks, and fatigue in the upper back/shoulders. * The prescription: Drills that disengage the arms and emphasize lower-body initiation. Think “step drills” or swings with the arms crossed across the chest. The goal is to get the pelvis velocity line to lead the graph again.
Another example is the Swing Performance Index, a single-score metric from a 2023 3D kinematics golf swing research study. It used three rotational velocity metrics to score swings. Professionals averaged a score of 100, amateurs averaged 82. That’s a massive, quantifiable gap. For a player, watching their index climb from 82 toward 90 as they improve their sequence is a powerful motivator, it turns a feel-based change into a measurable game.
This is where quality analysis pays for itself. It moves the conversation from “keep your head down” to “your pelvis is slowing down at impact because you’re not posting into your lead side; let’s work on that pressure shift.” It’s specific, it’s actionable, and it’s based on what your body is actually doing.
What a Good Swing Analysis Session Looks Like
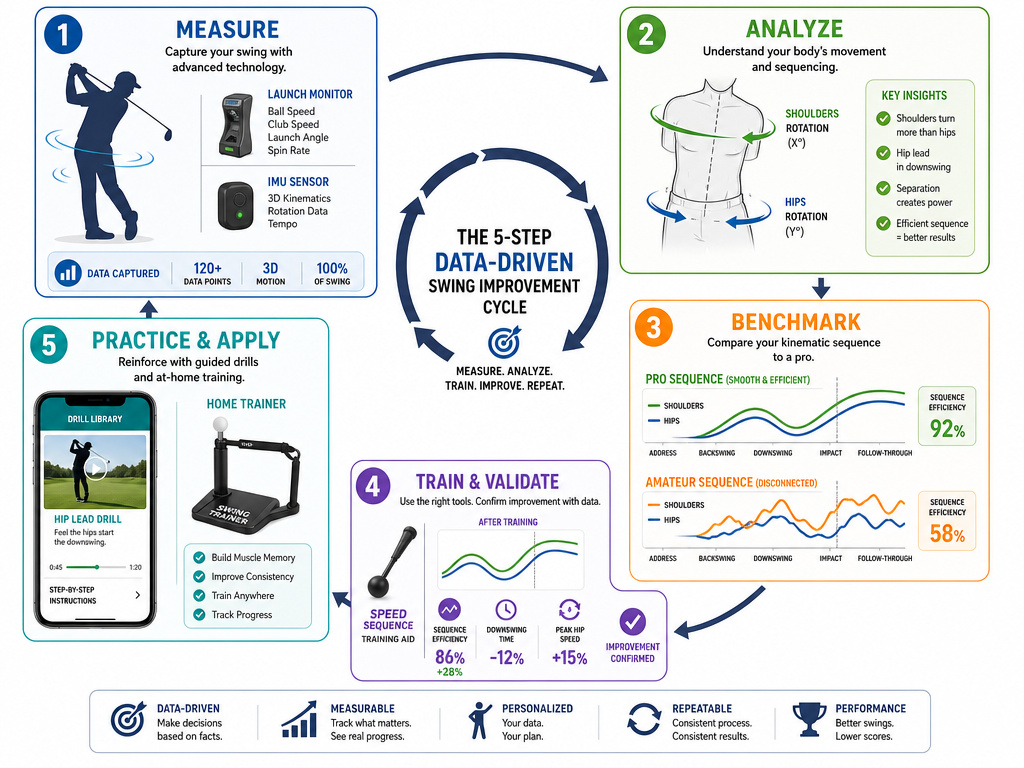 If you’re investing in a professional analysis, know what to expect. A thorough session won’t just be hitting balls into a screen.
- Baseline Assessment: You’ll hit a series of shots with your own club, often with both a launch monitor (like TrackMan or GCQuad) and an IMU sensor system running. This establishes your “normal” numbers and kinematic pattern.
- Physical Screen (Optional but Valuable): Many modern coaches, especially those with TPI training, will do a brief physical screen. Can you separate your hip turn from your shoulder turn while in your posture? This identifies mobility restrictions that dictate your swing.
- Data Review: The coach will show you the key graphs, your kinematic sequence and X-factor plot, alongside a pro model. They’ll point out the single biggest gap. “See here? Your arms are firing 30 milliseconds too early.”
- Targeted Drill Work: You’ll do 2-3 drills designed to override the faulty pattern. This might involve using specific swing training tools or exaggerated feels. The coach will re-measure you with the sensors to see if the drill is creating the desired change in the data.
- Take-Home Plan: You’ll leave with one or two drills to ingrain the new pattern, plus maybe a recommendation for a golf swing trainer for home use. The goal is to build the new motor pattern, not just understand the theory.
The best technology, from swing speed monitors to full IMU suits, is a feedback loop. You try a new feel, you see its immediate effect on your kinematic graph, and your brain makes the connection faster. It accelerates learning.
Frequently Asked Questions
What’s the difference between a launch monitor and a swing analyzer?
Launch monitor (like a swing speed radar) measures the result: clubhead speed, ball speed, launch angle, spin. It tells you what the ball did. A swing analyzer measures the cause: your body’s movements and sequencing. You need both for a complete picture, but if you’re working on mechanics, the analyzer is more directly useful.
Can I do a decent swing analysis with just my phone?
You can capture useful visual information. A slow motion camera on a sturdy phone holder can show you obvious flaws like early extension, swaying, or casting. However, your phone cannot measure the kinematic sequence or precise angular velocities. It’s a great tool for checking positions, but not for measuring the engine’s timing.
Is 3D motion capture worth the money for an amateur?
For most amateurs, a session with a coach who uses wearable IMU sensors provides 90% of the benefit for a fraction of the cost of a lab 3D session. The lab system is for research, elite players, or diagnosing persistent, complex issues that simpler systems can’t solve. Start with the capable, portable tech.
How often should I get my swing analyzed?
It depends on your phase of learning. If you’re making a significant mechanical change, every 2-3 weeks can provide crucial feedback to ensure you’re on track. For maintenance, once or twice a season is plenty. The goal is to use analysis to build a reliable, feel-based swing, not become dependent on the screen.
Do swing analyzers work for putting and short game?
The principles are the same, consistency in path, face, and timing, but the technology focus shifts. For putting, simpler devices that measure face angle at impact and stroke path are more common and useful than full-body kinematic sensors. The small, precise movements of the short game are a different analytical challenge.
Before You Go
Golf swing analysis demystifies the black box between your intention and the ball flight. It replaces guesswork with graphs, showing you the “why” behind your “what.”
The single most useful takeaway is the kinematic sequence graph. If you remember nothing else, remember this order: pelvis, torso, arms, club. Any deviation from that sequence is costing you. Whether you check it with a $10,000 sensor suite or simply by feeling if your arms are dragging your torso down, that principle holds.
Good analysis should make your game simpler, not more complicated. It gives you one clear thing to work on, with a drill that targets it directly. That’s how you build a swing that lasts, not by chasing perfect positions, but by engineering a reliable, efficient sequence.
