
What Is Strokes Gained Putting? A Complete Guide Explained
This post contains affiliate links. As an Amazon Associate, we earn from qualifying purchases.
This post contains affiliate links. As an Amazon Associate, we earn from qualifying purchases.
Strokes Gained Putting is a golf statistic that measures how many strokes you gain or lose on the greens compared to a benchmark, based on the exact distance of every first putt. It isolates putting performance by using a massive dataset, like the PGA Tour’s ShotLink, to determine the average number of putts a player should take from any distance, then compares your actual results to that standard.
That’s the textbook definition. It’s clean, correct, and utterly bloodless. The real story is what happens when you apply it to a real scorecard. You think you putted well because you had 28 putts. The metric says you lost two strokes to the field. One of you is wrong, and it’s almost certainly you. The old stats lie. Strokes gained doesn’t.
What follows is a breakdown of why this metric rewrote golf analytics, how to calculate it yourself, and the one counterintuitive research paper arguing that putting skill might be almost impossible to measure reliably.
Key Takeaways
- Strokes Gained Putting compares your putting to a distance-specific benchmark, making “putts per round” and “putts per GIR” obsolete because they are skewed by your approach shot quality.
- The benchmark is built from millions of tracked shots. On the PGA Tour, the average from 8 feet is 1.5 putts; from 33 feet, it’s 2.0 putts.
- A 2025 empirical Bayes study of PGA Tour data suggests putting performance is “nearly indistinguishable from noise,” meaning variance in putting stats may reflect luck more than measurable skill compared to tee-to-green play.
- You can calculate it manually: (Benchmark Strokes from Start) – (Putts Taken) – (Benchmark Strokes from Finish). Positive numbers are good.
- To use it, you need your first-putt distances. Apps like Shot Scope or Arccos automate the calculation; otherwise, keep a detailed putting log.
What Strokes Gained Putting Actually Measures (And What It Doesn’t)
The problem with counting putts is that it treats every stroke on the green as equal. A tap-in and a 40-footer both add “1” to your total, but they are not the same task. Strokes Gained Putting exists to capture that difference. It asks one question: given where your first putt started, how did you perform compared to what’s expected?
Strokes gained for putting is calculated using the formula: Starting Strokes (benchmark average from your first putt’s distance) minus Putts Taken minus Ending Strokes (benchmark average from where your ball finished). This isolates the quality of the putting stroke itself.
This metric only counts strokes taken on the putting surface with a putter. A chip from the fringe that goes in is a “zero-putt” green, which artificially boosts your traditional putting stats but doesn’t help your strokes gained putting number. The system is designed to see through that. It also adjusts for green difficulty in its Tour-level calculations, though most amateur apps use a universal distance baseline.
The real shift here is philosophical. Before this, we judged putters by results that were heavily influenced by other parts of the game. Now we judge the putt itself. It’s the difference between blaming the messenger and reading the message.
The Core Formula: How Strokes Gained Putting is Calculated
You need three numbers: where your ball started, how many putts you took, and where it ended. The benchmark data provides the expected strokes from those points.
The Strokes Gained Formula:
Strokes Gained = (Benchmark Avg. From Start) - (Putts Taken) - (Benchmark Avg. From Finish)
Let’s use the PGA Tour baseline. From the research, we know the average from 8 feet is about 1.5 putts. From 4 feet, it’s about 1.15 putts. The hole, of course, has a benchmark of 0.
Worked Example:
You have an 8-foot putt. You sink it. – Benchmark from 8 feet (Start): 1.5 – Putts Taken: 1 – Benchmark from the hole (Finish): 0 Calculation: 1.5 – 1 – 0 = +0.5 Strokes Gained.
You gained half a stroke on the field. Now, you miss that 8-footer but tap in from 4 inches (effectively 0 feet). – Benchmark from 8 feet (Start): 1.5 – Putts Taken: 2 – Benchmark from 0 feet (Finish): 0 Calculation: 1.5 – 2 – 0 = -0.5 Strokes Gained.
You lost half a stroke. This is the entire mechanism. Every putt gets a value, and the sum for the round is your total Strokes Gained Putting. The foundational Strokes Gained calculation hinges on this consistent, shot-by-shot application.
| Putt Distance | PGA Tour Avg. Putts to Hole Out | Make Percentage (approx.) |
|---|---|---|
| 3 feet | 1.01 | 99% |
| 8 feet | 1.5 | 50% |
| 20 feet | 1.88 | 15% |
| 33 feet | 2.0 | 5% |
Why Old Putting Stats Are Misleading (The Angel Cabrera Case Study)

Mark Broadie’s original 2011 paper, “Putts Gained: Measuring Putting on the PGA TOUR,” included a perfect case study. In a 2010 tournament round, Angel Cabrera took 26 total putts. The PGA Tour average is about 29. By the old standard, putts per round, he had a great day on the greens.
Strokes Gained told the opposite story: he lost 2.8 strokes to the field. Why the contradiction? 1. Two zero-putt greens: He chipped in twice. Those holes removed putts from his total without reflecting any putting skill. 2. Short first putts: His average first-putt distance was 9.6 feet, much closer than the Tour average of 17 feet. He had easier chances. 3. Poor performance on those chances: He three-putted from 22 and 20 feet and missed makeable 5 and 7-footers.
The benchmark expected a player with his starting positions to take about 23.2 putts. He took 26. The 2.8-stroke loss was the honest answer. This case killed “putts per round” as a serious metric. It shows why any meaningful Strokes Gained vs traditional stats discussion starts here.
Common mistake: Believing a low putt total means you putted well. It might mean you hit your approaches close, or you chipped in. Strokes gained filters that noise out.
The “Noise” Argument: Is Putting Skill Even Measurable?
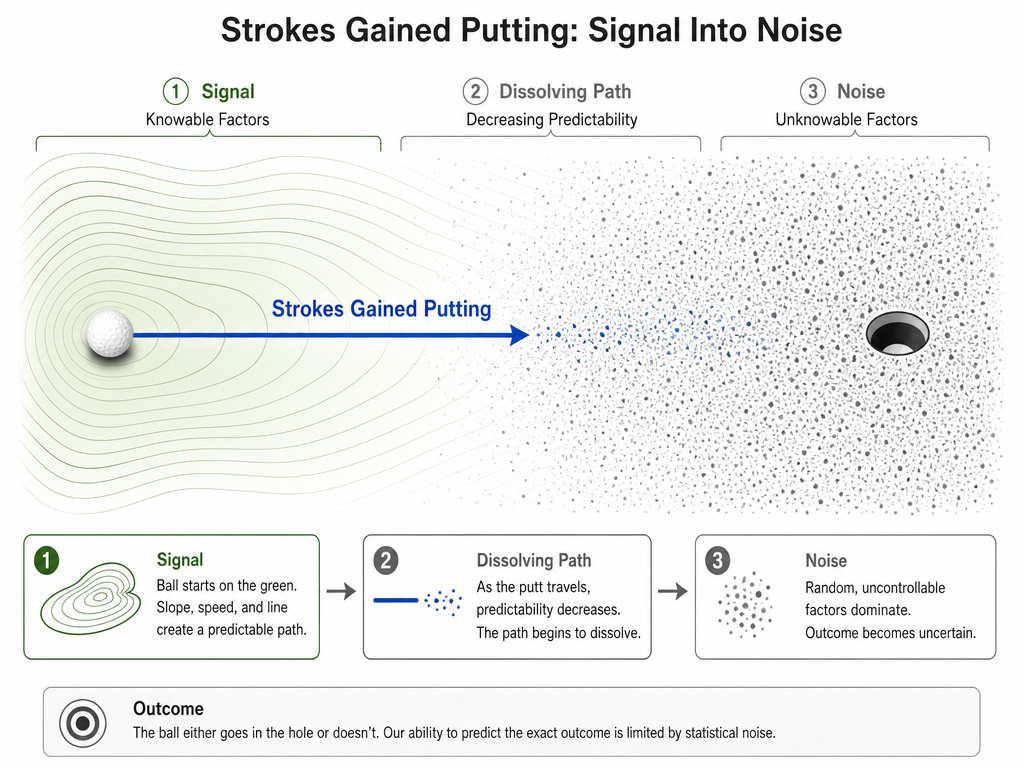
Just when you think the metric has everything figured out, along comes a curveball. A 2025 pre-print study on arXiv used an empirical Bayes analysis on 2015-2017 PGA Tour data. Its headline finding: “putting skill is both less variable and far less reliably estimable” than tee-to-green skill. The authors concluded that “putting performance appears nearly indistinguishable from noise.”
This doesn’t mean putting is unimportant. A hot putter still wins tournaments. It means that separating a player’s “true” putting talent from random short-term variance is incredibly hard. The study found that observed differences in putting stats between players over a season often fall within the range of statistical noise. In contrast, differences in driving and approach play are clearer, more stable, and more predictive of long-term success.
This research, titled “Putting Skill as Nearly Indistinguishable from Noise,” refines the fundamental Strokes Gained explanation. It suggests that while Strokes Gained Putting is the best tool we have, its readings for any single player over a limited time should be taken with a grain of salt. The metric is precise, but the skill it’s trying to measure might be faint.
How to Use Strokes Gained Putting to Improve Your Game
Forget tracking total putts. Your goal is to see where you leak strokes on the greens. Are you missing too many from 5-10 feet? Are you three-putting from long range because of poor speed control? The data will show you.
Step 1: Collect Your Data.
You need the distance of your first putt on every green and how many putts you took. No estimates. Use a GPS app, a rangefinder, or paced-off steps.
Step 2: Choose Your Benchmark.
Comparing yourself to PGA Tour pros is fun but brutal. More useful are Strokes Gained benchmarks for your handicap level. Apps like Shot Scope or Arccos provide these tailored baselines automatically.
Step 3: Analyze the Leaks.
After 5-10 rounds, your app or spreadsheet will show a pattern. It usually looks like one of these: – Negative from 4-8 feet: Your stroke or putting alignment is off. Practice short putts under pressure. – Negative from 20+ feet: Your lag putting is poor. Focus on distance drills, not making, to avoid three-putts. – Inconsistent pattern: This could be the “noise” factor or a mental block. Focus on routine.
| Weakness Identified | Likely Cause | Primary Fix |
|---|---|---|
| Poor performance 4-8 ft | Alignment, stroke path, tension | Gate drills, consistent routine, check putting grip |
| High three-putt % from 20+ ft | Bad speed/distance control | Lag putting drills (putt to a 3-foot circle) |
| Inconsistent across distances | Reading greens, mental focus | Practice reading grain and break |
Step 4: Practice with Purpose.
Don’t just hit putts. If your data shows you lose strokes from 6 feet, design a practice session where you must make 20 in a row from that distance before leaving. If long putts are the issue, spend an hour putting to tapes on the green, not to a hole.
Strokes Gained Putting in the Wild: PGA Tour Examples
The leaderboards tell the story. In 2011, the first year of the official stat, Luke Donald led the Tour with +0.844 strokes gained putting per round. The 118th-ranked putter, J.B. Holmes, was at -0.096. That’s a gap of about one stroke per round, or four shots per tournament, the difference between winning and missing the cut.
But leading the category doesn’t guarantee a money title. The 2025 research underscores why: the best ball-strikers have a higher, more stable floor. A great putter can go cold. A great driver and iron player gives himself birdie chances every round. This is the modern understanding that grew from Broadie’s work, explored in depth in the MIT Sloan putting performance study. It’s “drive for show, putt for dough” turned on its head.
Where this goes sideways: Chasing a great Strokes Gained Putting number by being overly conservative on approach shots. Hitting to 30 feet to avoid a tricky 15-foot downhill putt might help your putting stat but hurts your overall score. Don’t optimize the part at the expense of the whole.
Frequently Asked Questions
What’s a good Strokes Gained Putting number?
For a PGA Tour pro, anything positive is above average. Leading the Tour usually requires +0.8 to +1.0 per round. For amateurs, compare yourself to benchmarks for your handicap. A 10-handicapper gaining 0.5 strokes per round on other 10-handicappers is an excellent putter at that level.
Do puts from the fringe count?
No. Strokes Gained Putting only counts strokes from the putting surface with a putter. A putt from the fringe falls under “Strokes Gained: Around the Green.” This keeps the metric pure to the act of putting on a prepared green.
Can I calculate it without an app?
Yes, manually. Record your first-putt distance and putts taken for every hole. Use a published benchmark table (PGA Tour or amateur). Plug each hole into the formula and sum the results. It’s tedious but illuminating for a few rounds.
Why is my Strokes Gained Putting so different from my putts per round?
Almost always because of your approach shot proximity. If you hit greens but leave yourself 40-footers all day, your putts per round will be high, but your Strokes Gained might be average if you two-putt them all. Conversely, hitting it close leads to low putts per round, but you still might lose strokes if you miss those short ones.
Does putter fitting affect Strokes Gained?
Indirectly, but significantly. A putter with the correct loft and lie for your stroke helps you start the ball on line. The right putter type (blade vs. Mallet) can improve consistency. Better technique from a proper fit should, over time, improve your Strokes Gained numbers, especially from makeable range.
The Bottom Line
Strokes Gained Putting is the truth-teller. It cuts through the excuses and the misleading totals generated by other parts of your game. It tells you, with cold math, whether the flat stick was a asset or a liability. The core idea, comparing your outcome to a distance-specific expectation, is now being applied to every shot category, revolutionizing how we understand golf performance.
Embrace it not as a judgment, but as a diagnosis. It’s the X-ray that shows the fracture, not the bruise you’ve been complaining about. Use it to find your real weakness, practice with purpose, and stop guessing. The data doesn’t lie, even when it whispers the uncomfortable truth.
